Cognos R6 – Enhancements to Mapping, Dashboards, and Reporting

Cognos R6
What’s new in Cognos Analytics Release 6? One might as well ask what isn’t new in Cognos R6! OK a bit of an exaggeration, but for those charged with getting information into the hands and in front of the eyes of those who need it there are several new and improved features which make this release compelling.
Dashboards
If you are as “old school” as I am you’ll appreciate that use of PowerPlay Cubes is now supported in dashboards. Sadly, we’ll need to wait a bit for PowerPlay 11, but it is coming, rumored to be sometime around the same time frame as release 7.
For those of you interested in more recent technologies, support for Dynamic Cubes, DMR and TM1 is also here. Outside of the Cognos world, support for MSAS and other supported OLAP data sources is now in your dashboarding toolkit.
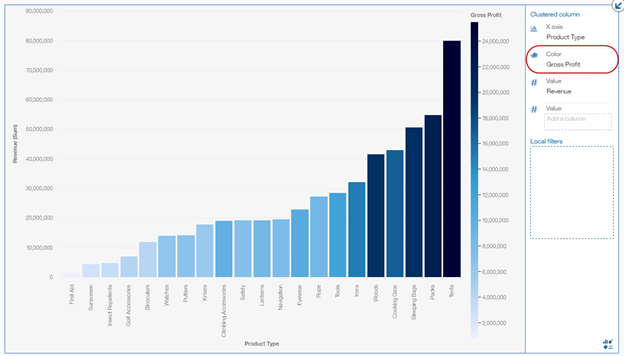
As far as your charting and graphing needs are concerned, IBM has added some features to make things better and easier in Cognos R6. You can keep the simplicity and clean lines of a bar chart (or word cloud, packed bubble, or other types) and include a second measure by using a color gradient to reflect relative values. If that chart uses dates as a series blank dates will now be bucketed and displayed automatically.
Maps
When (or if) you check out the IBM blogs speaking about new features you may encounter something like this: “With 11.0.6, we have integrated Pitney Bowes polygons that enables users to visualize their geospatial data across multiple admin boundaries…” Before your eyes glaze over, just understand that this means cool new stuff you can automatically do with maps.
In addition to adding more map styles, that bit about the polygons means better geospatial mapping in Cognos R6 ( zip codes, area codes, etc. ). You’ll be able to able to cut off the “which Springfield?” questions by providing context – “refining regions” in IBM-speak – to your place names.

For those locations the software can’t automatically resolve place names, you’ll get a handy list of those locations. If you want to be able to address these issues however, you’ll be back into your data. A UI to resolve ambiguously defined locations is promised in a future release.
Reporting
While as I announced at the beginning the big news in Cognos R6 news as the ability to use PowerCubes as a dashboard source, I know a fair number colleagues will be shouting about me burying the lede….. Cognos R6 now supports freezing column headings. Not the consumer-driven, change-the-look-of-the-report freezing that was available in Cognos 10. Sadly, this feature is only applicable to lists and not yet to crosstab reports, but I remain hopeful that this gap is addressed in future releases.
You’ll get some bumps in metadata management as well with improvements in tracking and displaying lineage information. As well, there’s new support for business glossaries if you use IBM InfoSphere Information Governance Catalog… I haven’t, if you have let me know how it works. The concept is powerful and if it works well, and could produce great value in a large implementation.

Other Stuff
Of course there’s other stuff…. loads of it! A nice place to start digging in further is right at the source:
Cognos R6 Brief – Detailed list of new features and FAQ:
http://www.pmsquare.com/main/uncategorized/cognos-analytics-r6-brief/
Cognos Analytics Communities:
Conclusion
I hope you find this article useful. Subscribe to our e-newsletter for more technical articles and updates delivered directly to your inbox.
Next Steps
If you have any questions or would like PMsquare to provide guidance and support for your analytics solution, contact us today.